Modelling a manufacturer
From bill of materials to P&L, and why manufacturing is where a model stops being a spreadsheet and becomes a system.

It’s the second week of the month, and four things have happened.
- Intake Raw milk intake is settling four percent above the contracted band.
- Energy Diesel is up eleven percent, which will reach cold-chain distribution about six weeks from now.
- Capacity Line 3 at the Ostrów plant is coming down for a fortnight in August for a rebuild that was scheduled for October.
- Demand The French retailer has confirmed the new listing: six codes, first delivery 1 April, with a promotional grid attached and a rebate tier that steps at €4m.
The CFO would like to know what Q3 gross margin does. By country. By channel. Before Thursday.
Not one word of that question appears in a three-statement model.
That is not a criticism of three-statement models. The P&L, the balance sheet and the cash flow are where the answer lands: they are the report card, and a good one. They are not where the answer is computed. The computation lives a floor or two below, in a structure that knows what a litre of raw milk becomes, which line it becomes it on, how much of it is lost on the way, what that line costs per hour, and which of six hundred thousand finished-goods codes touch any of it.
This is the honest reason manufacturing is worth writing about. Not because manufacturers are more sophisticated than anyone else, but because the arithmetic that produces their P&L is genuinely deep, genuinely wide, and genuinely changes every month. You can fake it at demo scale. You cannot fake it at real scale, and the failure is not dramatic. The model simply stops being able to answer questions before Thursday, and people quietly go back to asking the plant controller for a spreadsheet.
We’ll use a process manufacturer throughout, a dairy and chilled-foods group, because process manufacturing exercises the parts that break first.
One number, all the way down
Take a single number: gross margin on a 400g pot of strawberry yoghurt, sold to one French retailer, in March.
Start at the top. Net revenue is not the invoice. It’s list price less on-invoice discount, less the off-invoice rebate accrual, less the promotional allowance for the weeks the product was on deal, less the amortised listing fee. And the rebate is volume-tiered, which means this month’s accrual is a function of the full-year forecast for that customer. A March number that depends on a December expectation.
Now go down.
Cost of goods sold is standard cost × volume, plus variances. And the standard cost of that pot is itself a small model:
-
Recipewhat goes in
-
Yoghurt basesemi-finished, own recipe
-
Fermented milksemi-finished
-
Standardised milksemi-finished
-
Creamjoint product
-
Skimjoint product
-
Raw milk intakepurchased, priced on composition
-
-
-
-
Culturepurchased
-
-
Fruit preparationpurchased, own price curve
-
Sugarpurchased, commodity
-
Stabiliser (contains palm)purchased, commodity-linked
-
-
Packagingwhat it travels in
-
Pot, lid, sleeve, case, palleteach with its own waste factor
-
-
Conversionwhat it costs to make
-
Filling line minutes× cost-centre rate per minute
-
Changeover minutesallocated across the batch
-
Start-up and flush lossesmaterial that never reaches a pot
-
Then look at the last branch of that structure, because it hides the awkward part. The cost-centre rate is the fixed and direct cost of the centre divided by its planned activity volume. Which means the rate depends on the plan, and the plan depends on the rate, because cost drives price drives volume.
So before we have reached anything unusual, the model already has seven levels of depth and at least one deliberate second pass over its own output. This is what “deep” means, and it is why a manufacturer’s model does not look like a revenue model with more rows.
Where the arithmetic runs backwards
Go one level further down and you meet something a discrete-assembly mindset has no slot for.
Raw milk goes into separation. Cream and skim come out. Both are products. Neither is a by-product of the other. And there is no honest way to say what the cream cost, because the cost was incurred on the milk, before cream and skim existed as separate things.
IAS 2 handles this in a single sentence that is easy to read past: when the costs of conversion of joint products are not separately identifiable, they are allocated between the products on a rational and consistent basis, for example in proportion to relative sales value at the point the products become separately identifiable.
Read that as a modeller and it is startling.
A bill of materials is a tree that flows one way. Costs roll up, and every number above is the total of the numbers below it.
You take a parent cost and divide it down, on a basis that is itself a forecast. Change the butter price and the cost of skim milk powder moves. Nothing physical changed. The split moved.
Two more process realities that a parts-list mental model doesn’t carry:
Composition, not quantity
Raw milk is not a litre. It is fat and protein, and you pay for it on composition, yield on composition, and specify the finished product on composition. The same is true of cocoa butter content, dry matter, active ingredient, degrees Brix. The unit you buy in is not the unit of account.
Units that change on the way through
Litres in, kilograms out, cases shipped, pallets stored, tonnes reported to the group, and a customer whose contract is denominated per unit. Every conversion is a place a model can silently lose a factor of a thousand.
Scale: the number everyone quotes, and the one that matters
Now put the whole company on the table.
The naive reading is that this is an enormous grid: multiply it out and you’re in the trillions of cells. That reading is wrong in two directions, and both matter.
It’s sparse
Plant 7 does not make six hundred thousand codes; it makes eight hundred. The French retailer does not buy the range. Most of that grid is not zero, it is undefined, and the difference is not pedantic. A model that materialises the Cartesian product is doing arithmetic on a business that does not exist, and paying for it.
It’s deep
The real cost is not how many cells there are. It is how far a change has to travel. When one ingredient price moves, how many dependent values must be recomputed before a margin line is correct again? In the trace above, a single price touched seven levels of recipe, two allocation passes and a rebate accrual keyed to an annual forecast, and that was for one code, in one country, in one scenario.
Multiply that by every code that contains the ingredient, and you have the number that actually decides whether the model is usable.
This is why “it handles ten million rows” tells you nothing. Ten million rows of a flat table with no dependencies is a report; it’s a big read. A hundred thousand cells with a seven-level dependency graph, a joint-cost split, and a second pass for under-absorption is a model, and it is a different order of problem.
And note which direction the finance question runs.
| The engineer asks | Finance asks | |
|---|---|---|
| The question | What is in this product? | Which of my six hundred thousand codes contain palm oil, and what is twelve percent worth to me? |
| The traversal | Explosion: parent down to child, one product at a time. | Where-used: child up to every parent, across the entire graph. |
| When it’s asked | When the product is designed. | In the week that matters. |
Flexibility: the model changes as often as the plant does
Here is the part nobody budgets for. A manufacturing model is not built once and then operated. Its structure changes, routinely, as ordinary business:
- Reformulation A recipe is changed mid-year, palm to rapeseed, or a sugar reduction, and the old recipe is still needed for the months before the change.
- Capacity A line is commissioned. Another is mothballed.
- Rationalisation Six hundred thousand codes become four hundred and eighty thousand, and the deleted ones still have history that must report.
- Acquisition A plant is acquired, and runs its own costing method for two more years because that was the deal.
- Reorganisation The cost centre structure is redrawn because the organisation changed, not because the model wanted it to.
- New dimension A new packaging format arrives that needs a dimension nobody had.
The question is not whether a tool can express these. Everything can express them eventually. The question is how long each one takes, and who does it. If the answer is “raise a change request, six to eight weeks”, the model has stopped tracking the business it describes.
Finance goes back to spreadsheets, not out of nostalgia, but because a spreadsheet can be changed on Tuesday.
And structure is only half of it. The other half is exceptions, and every real manufacturing model is one general rule plus several hundred local ones:
- Tolling The arrangement where you never own the material. You’re paid a conversion fee, so material cost must be out of that plant’s margin and in the group’s.
- Excise The country with a duty sitting between gross and net.
- Rebate year The customer whose rebate year starts in April.
- Scrap booking The plant that books scrap to a different cost centre because it always has, and the auditors have signed it for a decade.
- Co-packing The co-packer making three of your codes, so those carry a purchase price rather than a standard cost, and still have to appear in the same margin report as everything else.
These are not untidiness to be normalised away. Taken together they can be fifteen percent of the P&L, and they are disproportionately the part people argue about. So the design question is precise: can an exception be local? Can a rule apply to one plant, one customer, one product family, one period, without forking the model, and without spawning a workbook beside it?
When it can’t, one of two things happens. The exception is ignored, and the model is wrong in a way somebody knows about and nobody has written down. Or it’s handled outside the model, and now there are two models, and they begin to drift the day they’re created.
Events: the things that happen once
Models are built to express recurring relationships: volume times rate, quantity times price. But a large part of a manufacturing year is not a relationship at all. It is a dated event.
- August Line 3 down for a fortnight. Lost capacity, volume transferred to another plant at a different cost, and under-absorption at the origin.
- September A new line commissions. Three months of a yield curve, scrap well above steady state, and a rate that only makes sense once it reaches design speed.
- 1 April A listing win. First delivery on the first of the month, pipeline fill in March.
- Dated A delisting. Revenue stops on a date, and packaging obsolescence hits once.
- 1 April A price increase, notified sixty days ahead, so Q1 carries a forward-buy distortion that reverses in Q2.
- October An energy contract resets.
- Unplanned A recall.
When it starts, and when it stops. Rarely on a month boundary.
This line, this family, this country. Not the whole model.
An event is rarely a step. It’s a ramp, a curve, a partial month, a fill followed by a run rate.
Spreadsheets handle events by hardcoding. Someone types a number over a formula, in one cell, in one column. It works. It is invisible. And it is the single most reliable source of a model nobody fully trusts, because the moment the event has to move by a month, or apply in the downside case but not the base, the override is orphaned and no one can find all of its siblings.
A model handles an event by making it a thing: named, dated, scoped, shaped, owned, participating in the calculation rather than overwriting it. Then it can be switched off in one scenario and on in another, moved a month without archaeology, and, most valuable of all, explained to someone who asks why August looks like that.
Simulation: one price, a million cells
Now the part that ties it together, and it comes with a real example.
In April 2026 the FAO Vegetable Oil Price Index rose 5.9 percent in a single month, to its highest level since July 2022. Palm oil rose for a fifth consecutive month. The FAO’s own explanation of why is the useful bit: demand from the biofuel sector, supported by policy incentives, and higher crude oil prices. The FAO notes plainly that higher crude oil prices increase biofuel demand and put additional pressure on vegetable oil markets.
Read that as a modeller and the shape of the problem appears.
Follow palm oil at plus twelve percent and count the ground it covers:
- 01Every recipe containing it, at every level: a where-used inversion across the whole graph.
- 02Yield and scrap, because now the losses are on a more expensive material.
- 03The standard cost of every semi-finished and finished code above it.
- 04Margin by code.
- 05Margin by customer, which moves the rebate accrual, because some tiers are margin-linked.
- 06Margin by country, after transfer prices that were set on the old standard.
- 07Inventory revaluation, because the standard changed mid-year and there is stock on hand.
- 08The group P&L, in reporting currency.
And then the honest part: that is only the naive simulation. At plus twelve percent, the reformulation becomes economic. So the recipe changes, which changes the cost, and the yield, and the line speed, and the shelf life, and possibly the artwork and the label claim. The question worth asking is never “what if the price rises”. It is “what if the price rises and we respond”, which means your response has to be inside the model too, as an event with a date and a scope.
And it is never one run. It is a grid:
Thirteen runs, rebuilt every time the buyer sends a new forward curve. Which makes speed a design property, not a nicety. If a run takes overnight, nobody runs the grid. They run one case, once, and call it the scenario.
Recalculation time doesn’t just determine how fast you get an answer. It determines how many questions get asked.
And the difference between a company that asks four questions a quarter and one that asks forty is not a reporting difference. It’s a management difference.
In Novi
The reason to describe all of this in one article is that these are not six problems. They are one problem seen from six sides, and they have to be solved by one structure, otherwise the seams between the solutions become the place the numbers go wrong.
Dictionaries
The recipe is not a table somebody maintains. It’s a dictionary relationship, parent and child, which means explosion and where-used are the same structure read in two directions, and “which codes contain palm oil” doesn’t need a separate index built by hand.
Time
Because time is a real dimension rather than a column layout, an effective-dated reformulation isn’t a second copy of the model. The March cost and the September cost of the same code are two reads of one structure.
Links
Links carry calculated results from one table to the next. The cost-centre rate computed in one place arrives in standard cost as a computed value, not a paste. That’s what makes the seven-level cascade a single model instead of a chain of exports.
Subsets
Subsets are what let an exception stay local. The tolling plant, the excise country, the April rebate year, the co-packed codes: each is a rule scoped to a slice, sitting inside the model rather than beside it in a workbook that drifts.
Scenarios
A dimension, not a duplicate of the model. A price path and a reformulation response are two axes you can cross, which is the only way a grid of cases stays maintainable when the structure underneath it is still changing every month.
Mapping definitions
Plant codes translate to group codes, and ERP cost centres to reporting centres, without a lookup sheet that someone has to remember to update.
And the formulas stay legible: readable by the analyst who inherits the model in two years, and readable by the machine that has to recompute six hundred thousand codes when one price moves.
None of that is exotic. It’s just what it takes for the answer to arrive before Thursday.
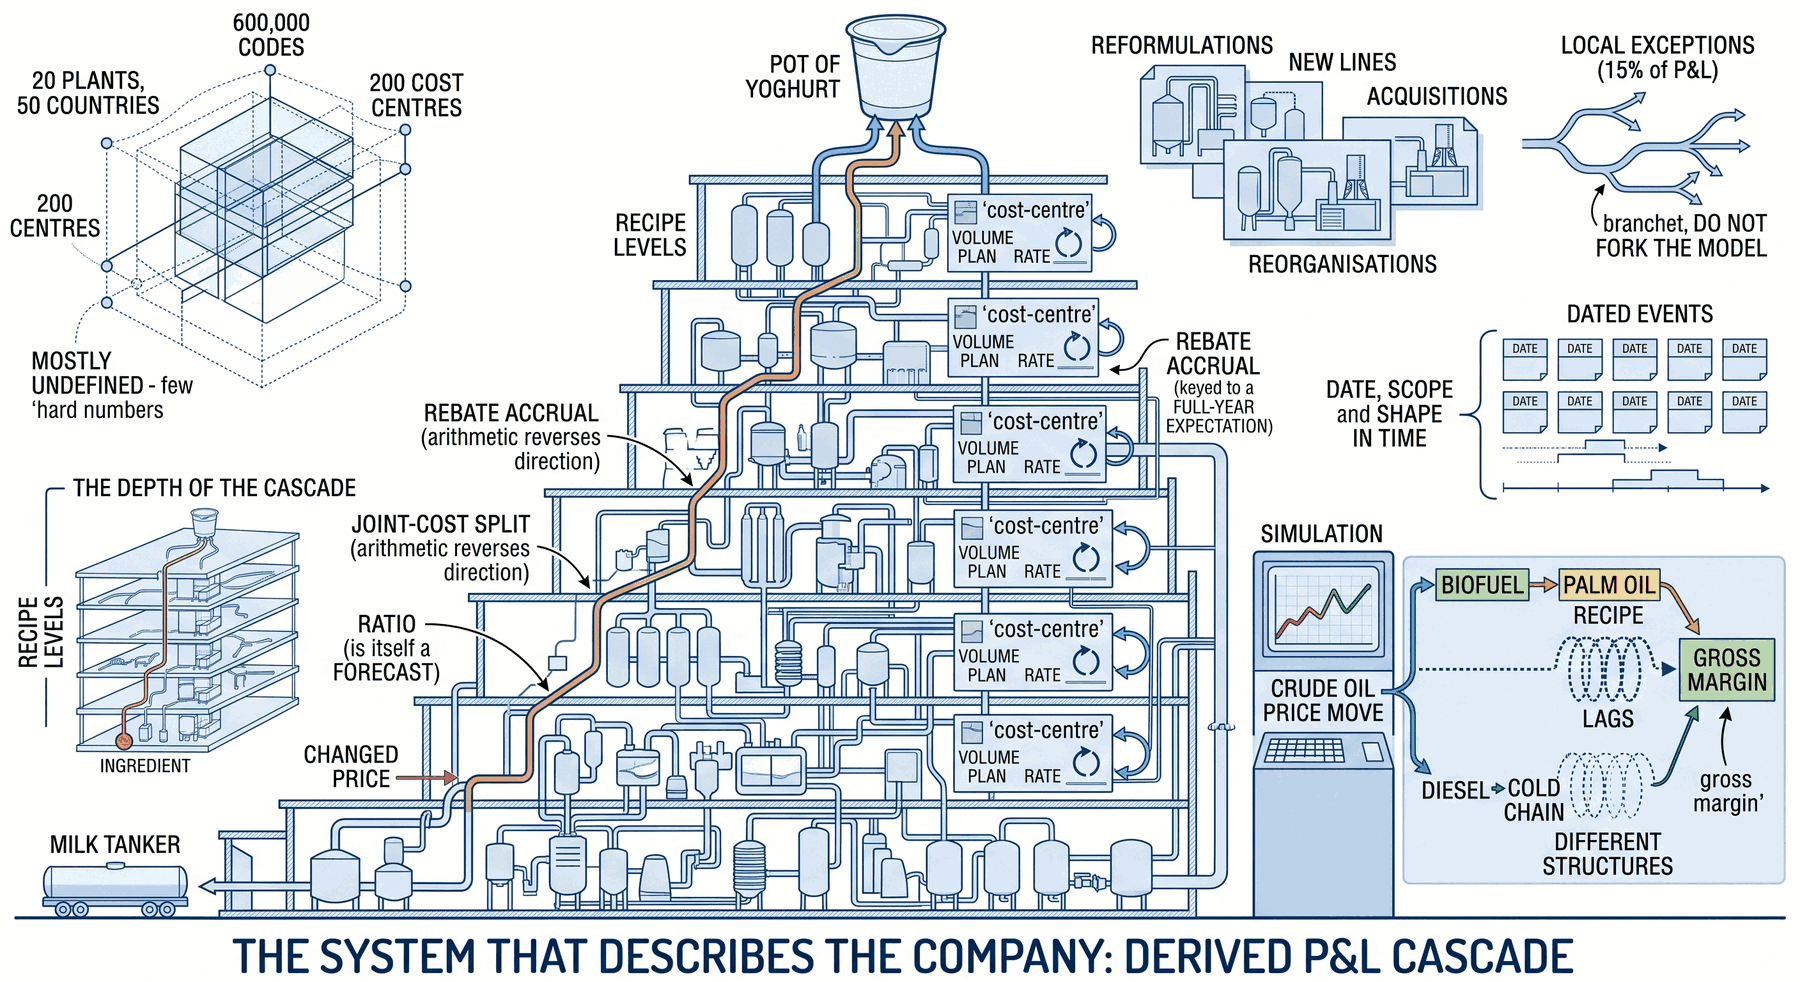
A manufacturer’s P&L is not entered, it is derived, and the derivation is deep. One pot of yoghurt sits seven recipe levels above a milk tanker, with a cost-centre rate that depends on the volume plan that depends on the rate, a joint-cost split where the arithmetic reverses direction and the ratio is itself a forecast, and a rebate accrual keyed to a full-year expectation.
Scale that to twenty plants, six hundred thousand codes, fifty countries and two hundred cost centres and the hard number is not the cell count (the grid is mostly undefined) but the depth of the cascade: how far one changed price has to travel before a margin line is right again. On top of that, the structure itself moves constantly through reformulations, new lines, acquisitions and reorganisations; fifteen percent of the P&L lives in local exceptions that must not fork the model; and a large part of the year is dated events rather than recurring relationships, each needing a date, a scope and a shape in time, not a number typed over a formula.
And it all converges in simulation: when crude oil moves, it reaches your gross margin twice, once through biofuel demand into palm oil into your recipe, once through diesel into your cold chain, on different lags, through different structures, into the same cell. Do that as a grid of cases rather than a single run, fast enough that people keep asking, and you no longer have a spreadsheet with a lot of tabs. You have a system that describes the company.
- IFRS Foundation – IAS 2 Inventories (¶13 fixed overhead absorption on normal capacity; ¶14 joint products and by-products)
- IFRS Community – Cost of Inventories under IAS 2
- FAO – Food Price Index up for third consecutive month, largely on rising vegetable oil prices (April 2026 release)
- CIPS – Bills of Material in the Supply Chain
Seven levels, one structure
Recipes as dictionary relationships, time as a real dimension, exceptions scoped to a slice, and scenarios as an axis you can cross. That is what it takes for one changed price to reach the margin line before Thursday.