In defence of Excel
The most successful programming language ever shipped grew out of budgeting. Finance never stopped speaking it.

Spend a day with an FP&A team and count the applications on their screens. The ledger, a reporting tool, a data warehouse, quite often a planning system, and a chat window that never goes quiet. Then watch where the work actually happens, the part where a question from the CFO turns into a number you would defend in front of the board. Almost every time, it happens in Excel.
That isn’t a hunch. In late 2024 the Association for Financial Professionals surveyed 362 FP&A practitioners around the world. 96% used spreadsheets for planning every day or every week, 93% used them for reporting, and every one of them used spreadsheets at least once a quarter. These were not people short of software, since 71% also planned in dedicated planning tools. AFP added that the figures “hold true when considering company size, geography, type of ownership and level of seniority”. Whatever else is on the desk, Excel is the one tool in every kit.
This is the first post in a series we’re calling Spreadsheets: love & limits, and it’s about the love. We’ll take Excel’s side from the first line to the last, with no “but” in the final paragraph, and ask a question finance rarely asks because the answer feels obvious. Why? The usual answer is habit. The research says something more interesting. Computer scientists, psychologists, economists, historians and accounting researchers have been studying the spreadsheet for more than forty years, and read side by side they tell one consistent story. Excel was never imposed on finance. It fits the work.
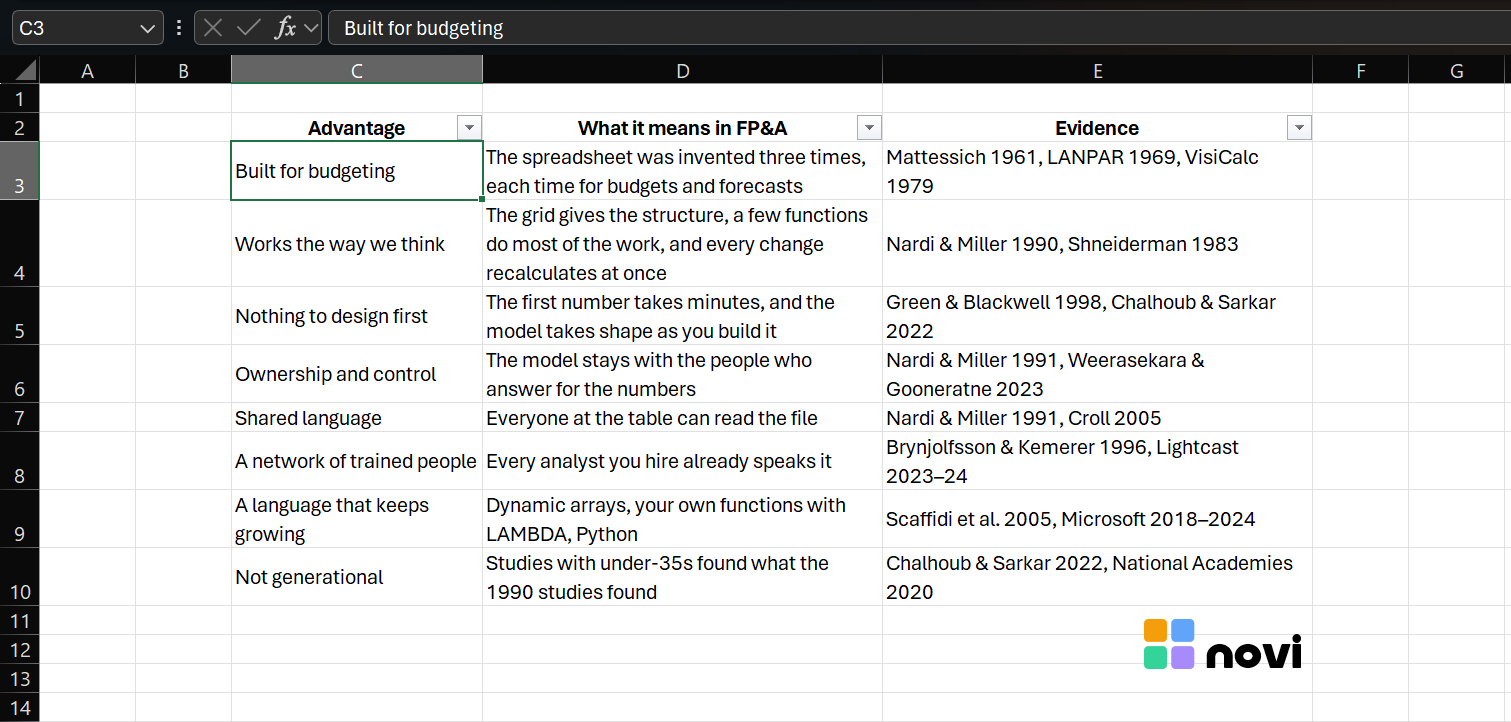
Finance wrote the specification
The electronic spreadsheet was invented at least three times, and each time the problem on the table was a budget.
In 1961 Richard Mattessich, an accounting professor at Berkeley, published “Budgeting Models and System Simulation” in The Accounting Review. In 1964 a book followed, Simulation of the Firm through a Budget Computer Program, with the program written in FORTRAN by his research assistants. In 1969 Rene Pardo and Remy Landau built LANPAR, which in Pardo’s account was used by “the budgeting department of AT&T and every telephone company in North America throughout the early 1970’s”. Its central idea, that formulas calculate correctly in whatever order you enter them, is one every spreadsheet has relied on since.
The third invention is the one that reached everybody. In 1978 Dan Bricklin was an MBA student at Harvard Business School, working cases by hand, where one wrong number early on meant every figure after it was wrong too. He “imagined a magic blackboard that if you erased one number and wrote a new thing in, all of the other numbers would automatically change, like word processing with numbers”. When the prototype worked, he tried it on a case: “I did five-year projections. I did all sorts of different scenarios.” His publisher remembers pitching VisiCalc as “an ‘electronic blackboard,’ useful for building budgeting and financial planning models”, and NPV and IRR were in it at launch because a finance professor asked for them.
Even the name is ours. Long before computers, a spread sheet was the wide sheet of analysis paper accountants ruled into columns, “a worksheet providing a two way analysis of accounting data”, as a 1952 dictionary for accountants defined it. VisiCalc copied it on purpose, and its first buyers knew what to do with it. Writing in 1984, the computer scientist Alan Kay observed that most people who bought VisiCalc “exploited it to forecast the future rather than to account for the past”. That is the FP&A job description, written more than forty years ago.
Finance didn’t adopt the spreadsheet. Finance specified it.
The researchHow budgeting built the spreadsheet →
It works the way we think
Ask an analyst why they build in Excel and you’ll hear that it’s flexible. The research is more precise than that, and worth knowing, because each finding describes something we do every day without thinking about it.
The structure comes with the tool. Around 1990 Bonnie Nardi and James Miller interviewed spreadsheet users at length, among them a CFO, a controller, a finance manager and several accountants. One observation stands out: users “do not have to invent a structure”, because “it is given to them”. Line items go down, periods go across, and a new analyst can read a stranger’s model on the first morning.
The language is small. Users needed “only two concepts: cells as variables, and functions as relations between variables”, and “most users normally use fewer than ten functions in their formulas”. A quarter of a century later, a study of more than 15,000 spreadsheets from Enron’s email archive found that 76% of them used the same fifteen functions. You don’t need all of Excel to be fluent in the part that runs a budget.
You work with real numbers, not variables. Kay admired “the ability to make a solution generic by ‘painting’ a rule in many dozens of cells at once without requiring users to generalize from their original concrete level of thinking”. In FP&A terms, you write January’s formula against January’s numbers, check that it’s right, and drag it across to December. Nobody writes a loop.
Every change shows its consequences at once. Ben Shneiderman, who coined the term “direct manipulation”, used VisiCalc as his showcase in 1983. His example could be any sales model: costs, sales, commissions and profits by district and by month, laid out “so that the impact of changes on profits is immediately apparent”. Users, he wrote, “feel in control, and can predict system responses”. Nardi and Miller called it the spreadsheet’s “twinkling lights”. Users “experience a real sense of computational power as their modifications to data values and formulas appear instantly and visibly in the spreadsheet”. They added something they could say of no other software they knew: people with no particular interest in computers wrote spreadsheets voluntarily, for problems their jobs never asked them to solve.
Nothing has to be designed before the first number. Thomas Green and Alan Blackwell, two of the researchers behind a framework for judging how usable a notation is, called the spreadsheet “an abstraction-hating system”, and meant it kindly: “One reason why spreadsheets are so popular is that they are weak on abstractions.” A 2022 study at CHI, the main conference on human-computer interaction, put it in one line. The grid starts “its abstraction gradient at zero”, and “it requires very little premature commitment”. Anyone who has had a question land at four in the afternoon for a nine o’clock meeting knows why that matters. There is no time to design a data model. There is always time to open a blank sheet.
Nardi and Miller’s summary still holds. The spreadsheet’s “single biggest advantage”, they wrote, “is not cognitive but motivational: after only a few hours of work, spreadsheet users are rewarded by simple but functioning programs that model their problems of interest”.
The researchWhy the grid fits how we think →
We build models to find out what we think
Most real models start with a question, not a specification. Nardi and Miller watched users begin with “only a general goal in mind” (their example was “maximize profits over the next three quarters”) and discover which variables mattered “in the process of actually trying to solve it”. One of them, who built business plans for joint ventures, preferred to write the model himself rather than brief someone else, because “I was learning about all the variables that I needed to think about”. A manager who ran a finance department at a large corporation called his favourite technique “reconstructive surgery”: “I can really move things around, change the whole look and feel and objective of a spreadsheet very quickly.”
That is how FP&A works. The first version of a model is how you find out what the model should be. The upside and the downside sit side by side on the same sheet, which is how the people in a 2019 study of uncertainty handled their scenarios too. And the people we build for think the same way. In Nardi’s fieldwork, a CFO “does not organize his thoughts until he has the spreadsheet artifact to look at, react to, and critique”. Anyone who has walked a CFO through a draft bridge will recognise that sentence.
Steven Levy saw what was happening in 1984, in a Harper’s essay that reads like a founding charter for our profession. “The spreadsheet is a tool, and it is also a world view,” he wrote, a view of “reality by the numbers”. What charmed users most was “the ‘what if’ factor: the ability to create scenarios, explore hypothetical developments, try out different options”. Bob Frankston, VisiCalc’s co-author, told him: “In the past, before spreadsheets, people would have taken a guess. Now they feel obligated to run the numbers.” Scenarios, reforecasts, sensitivity tables, the expectation that every decision comes with a model: finance didn’t bring those habits to the spreadsheet. The spreadsheet taught them to us.
It keeps the numbers with the people who own them
Ownership comes up in almost every study, and the words have barely changed in thirty years. In the 2022 CHI study, 16 of 21 interviewees said that working in free-form sheets gave them “a sense of flexibility, control, autonomy and ownership”. One of them put it better than any brochure could: “It’s freedom to put things where my mind wants to put them.” Another study published the same year followed people who work with data without being professional analysts. They used tables as “a trusted window” that gave them “both precise control and a sense of confidence and ownership”, and one of them called Excel “pretty much our best friend”. The researchers asked whether organisations that keep spreadsheets next to their business-intelligence tools are “simply unsophisticated”, answered with an emphatic no, and called their most salient finding “the sheer irreplaceability of the table form”.
In finance, ownership isn’t vanity. It’s speed, and it’s accountability. Nardi and Miller saw that the spreadsheet works as well as it does “because users themselves control the process of putting information into spreadsheet models”. Problem solving “is handled locally, without requiring the intervention of personnel from other work groups”, which the controller they interviewed found “especially valuable” for “fighting last minute fires”. Thirty years later, a 2023 case study of a manufacturer running its transactions on a large ERP found the budget still in Excel for the same reason. “When there are many unpredictable changes,” a management accountant explained, “it’s more convenient to make changes to excel sheets” than to the ERP. Standard reporting moved into the system. The plan stayed with the people who own the assumptions.
The researchWhy finance never left Excel →
Everyone at the table speaks it
A spreadsheet is also how finance talks to everyone else. “The shared semantics of the table facilitate knowledge transfer between co-workers,” Nardi and Miller wrote, because “the very structure of the rows, columns and cells of the table transmits a great deal of information”. They watched a controller and her CFO build the annual budget estimates by editing the same file in turn, until “the model emerged in successive approximations as Laura and Jeremy passed it back and forth for incremental refinement”. They watched a finance manager issue “targeting templates” to standardise expense targets across departments, with each member of staff building their own area on top.
The language travels well beyond finance. In Enron’s email archive from 2000 and 2001, 9.6% of 717,102 emails sent or mentioned a spreadsheet, and about a hundred a day carried one as an attachment. Among them is a draft “2002 Corporate Allocations spreadsheet” with columns for Plan 2001, Actual YTD 2001 and Plan 2002, a file any of us could open today and follow in a minute. In the City of London, a 2005 study heard that “Excel is everywhere - it is the primary front-line tool of analysis in the financial business” and that “Spreadsheets are the user interface into the deal”. In British infrastructure projects, “The financial model” was a defined term in the legal agreements.
Economists measured this network while the spreadsheet market was still being fought over, and found it was made of people rather than files. Erik Brynjolfsson and Chris Kemerer studied spreadsheet prices from 1987 to 1992. A 1% larger installed base went with a 0.75% higher price, and products that kept the Lotus 1-2-3 menus users already knew sold for about 46% more. Their explanation is the part worth keeping. Incompatible files could be solved “through one-time construction or purchase of a converter”, whereas moving people to a new interface “would require an investment by every user in re-training”. The valuable asset was the trained user.
You can still see that in the product. Nearly twenty years after the ribbon replaced Excel’s menus, Microsoft’s own list of shortcuts still offers Alt+E+S for Paste Special alongside Ctrl+Alt+V, and V still means values. Excel’s advanced options still contain a section headed Lotus compatibility. Our muscle memory is part of the platform.
The network renews itself because every employer asks for it. In US job postings for accounting and finance roles, Excel was the most requested software skill, named in 932,287 postings between March 2023 and March 2024. ICAEW now publishes a Spreadsheet Competency Framework with 82 competencies across four levels, mapped to the accountants in industry who prepare “budgets and forecasts”. And the skill still passes from person to person the way a craft does. In a survey of 1,597 business spreadsheet users, 52% had learned from colleagues’ demonstrations and only 38% had ever had classroom instruction. One participant in a 2018 study, describing how the skill moves around a finance firm, called it “almost an apprenticeship, somewhat medieval in its nature”. Every model you inherit teaches you something, and every model you hand over teaches someone else.
The researchExcel in FP&A, by the numbers →
The most successful programming language ever shipped
We rarely call what we do programming, and that is part of the design. Simon Peyton Jones of Microsoft Research and two academic colleagues wrote in 2003 that “the commercial success of spreadsheets is largely due to the fact that many people find them more usable than programming languages for programming-like tasks”. Spreadsheet users “need not think of themselves as doing ‘programming’”, they added. They “simply ‘write formulae’ or ‘build a model’”.
It is programming all the same. A SUMIFS over a ledger extract is a query. A driver-based forecast is a program, with its inputs on one tab and its logic on the next. In 2005 Chris Scaffidi, Mary Shaw and Brad Myers of Carnegie Mellon estimated that by 2012 the United States alone would have more than 55 million people using spreadsheets or databases at work, against fewer than 3 million professional programmers. Researchers at TU Delft write that spreadsheets “can be considered to be the world’s most successful end-user programming language”. Microsoft’s own researchers go further and say Excel formulas are written “by an order of magnitude more users than all the C, C++, C#, Java, and Python programmers in the world combined”. That last one is Microsoft describing Microsoft, with no method published, but even a generous discount leaves the point standing.
The language also keeps growing without asking anyone to move. Dynamic arrays rolled out between 2018 and 2020, and with them went Ctrl+Shift+Enter for most of us. LET followed in 2020. LAMBDA, generally available since 2022, lets us write our own functions and made the formula language Turing-complete, which is computer science for “able, in principle, to compute anything”. Python in Excel came in 2024. Excel first shipped, on the Macintosh, on 30 September 1985. Four decades later it is still adding words to a language that, by Microsoft’s own description, hundreds of millions of people already speak.
The researchIs Excel a programming language? →
Four generations, one grid
Most of the research above was done before most of today’s analysts were born, so it’s fair to ask whether Millennials and Gen Z, with their different priorities, feel about the grid the way the people interviewed in 1990 did.
Start with the labels. In 2020 the US National Academies of Sciences, Engineering, and Medicine reviewed the evidence on generations at work and concluded that “a focus on generational characteristics is not supported by science”. In the few studies able to separate the effects, age and the times everyone lives through mattered more than year of birth. Even Pew Research Center, which has long published research by generation, now uses the labels only where its data allow a fair comparison.
The spreadsheet’s advantages were never a generational taste in any case. Seeing the numbers, changing one and watching the rest move, building a model one step at a time: those are features of how people learn and pay attention, not of when they were born. Of the 21 people interviewed for the 2022 CHI study quoted above, 18 were between 18 and 34. The words about freedom, control and ownership are Millennial and Gen Z words, and the researchers concluded that “the flexible grid remains overwhelmingly successful”.
The workplace agrees. AFP’s 96% holds at every “level of seniority”. Students compete at Excel: more than 3,500 from nearly 500 universities entered the qualifying rounds of the Microsoft Excel Collegiate Challenge in 2023, and the Microsoft Excel World Championship was first streamed on ESPN in 2021. The one survey we found that splits finance staff by age, a small 2025 poll by a finance-software company, had 54% of the youngest group saying they love Excel, against 39% of their older colleagues. That may say more about career stage than birth year, since juniors build the models and seniors review them. Either way, it isn’t a generation walking away.
Nobody is born knowing Excel, and research has retired the “digital native” as well. One review found “no such thing as a digital native who is information-skilled simply because (s)he has never known a world that was not digital”. Each new cohort learns the grid the way the last one did, at work, from the colleague at the next desk. The apprenticeship is still taking apprentices.
The researchExcel across generations →
When Excel is the FP&A tool
For a certain shape of FP&A function, Excel is neither a starting point nor a stopgap. It’s the right tool, and we recommend it without hesitation. The shape is this:
- The function is centralised. A small team owns the model end to end, and the people who build it are the people who present it.
- Planning runs top-down. Targets are set at the centre and cascaded, not collected from hundreds of budget holders.
- The work is full of custom and individual cases. One-off deals, bespoke analyses, exceptions that fit no template, and a different question every week.
- There aren’t many systems to integrate. Actuals arrive as a ledger export, perhaps with a payroll file and a CRM extract, and that is the whole data landscape.
Each condition plays to a strength the research describes. A centralised team is the arrangement Nardi and Miller watched: the person who knows the business owns the model, a colleague with deeper Excel skills adds the harder parts, and a change takes minutes because nobody outside the team has to be asked. Top-down planning is what the targeting templates were for. The centre sets the frame, and everyone builds on it. Custom cases are where an abstraction-hating tool wins, because every exception can have its own sheet and none of them has to be foreseen in a design. And when the data comes from a handful of sources, the grid is the natural place for it to meet.
In that setting our recommendation is plain: Excel is the FP&A tool. Treat it as one. Invest in the people who are best at it, agree on shared conventions for building models, and give the team time to learn the newer parts of the language.
In short
- The spreadsheet was invented three times, each time for budgeting. Finance wrote the specification.
- It works the way we think. The grid supplies the structure, the language is small, the numbers are concrete, and every change recalculates at once.
- It lets us think by building. The first version of a model is how we find out what the model should be.
- It keeps ownership of the numbers with the people who answer for them.
- It is the shared language of business, and its network is made of trained people, which is why every employer still asks for it.
- By any reasonable count it is the most widely used programming language in the world, and it is still growing.
- The love isn’t generational. The recent studies, run mostly with people under 35, found what the first ones found.
- For a centralised, top-down FP&A function with many individual cases and few systems to integrate, Excel is the FP&A tool.
That’s the love. The next post in the series looks at where Excel breaks.
The research behind this post
The argument above rests on forty years of published research, far more than one post can hold. We’ve gathered it on six research pages, one for each part of the argument, with the studies, the figures, the best quotes and every source linked.
- Association for Financial Professionals, 2025 FP&A Benchmarking Survey, press release (January 2025)
- Mattessich, Spreadsheet: Its First Computerization (1961–1964), DSSResources
- Pardo, LANPAR, renepardo.com
- Bricklin, Meet the inventor of the electronic spreadsheet, TEDxBeaconStreet (2016)
- Fylstra, Personal Account: The Creation and Destruction of VisiCalc, Computer History Museum (2004)
- Computer History Museum, PC Software Workshop: VisiCalc, oral history (2004)
- Kay, Computer Software, Scientific American 251(3) (September 1984)
- Levy, A Spreadsheet Way of Knowledge, Harper’s (November 1984), reprinted by Wired (2014)
- Nardi and Miller, The Spreadsheet Interface: A Basis for End User Programming, INTERACT ’90 (1990)
- Nardi and Miller, Twinkling Lights and Nested Loops: Distributed Problem Solving and Spreadsheet Development, International Journal of Man-Machine Studies 34(2) (1991)
- Nardi and Zarmer, Beyond Models and Metaphors: Visual Formalisms in User Interface Design, HP Laboratories technical report (1990)
- Shneiderman, Direct Manipulation: A Step Beyond Programming Languages, IEEE Computer (1983)
- Green and Blackwell, Cognitive Dimensions of Information Artefacts: a tutorial (1998)
- Chalhoub and Sarkar, “It’s Freedom to Put Things Where My Mind Wants”: Understanding and Improving the User Experience of Structuring Data in Spreadsheets, CHI 2022
- Bartram, Correll and Tory, Untidy Data: The Unreasonable Effectiveness of Tables, IEEE Transactions on Visualization and Computer Graphics 28(1) (2022)
- Borghouts, Gordon, Sarkar, O’Hara and Toronto, Somewhere Around That Number: An Interview Study of How Spreadsheet Users Manage Uncertainty (2019)
- National Academies of Sciences, Engineering, and Medicine, Are Generational Categories Meaningful Distinctions for Workforce Management? (2020)
- Pew Research Center, How Pew Research Center will report on generations moving forward (May 2023)
- Kirschner and De Bruyckere, The Myths of the Digital Native and the Multitasker, Teaching and Teacher Education 67 (2017)
- University of Arizona, Eller College of Management, Second annual Microsoft Excel Collegiate Challenge (December 2023)
- Financial Modeling World Cup, About us (organiser of the Microsoft Excel World Championship)
- ITPro, Microsoft Excel is still alive and kicking at 40 (December 2025), reporting a vendor survey of 212 finance professionals
- Hermans and Murphy-Hill, Enron’s Spreadsheets and Related Emails: A Dataset and Analysis, ICSE 2015
- Croll, The Importance and Criticality of Spreadsheets in the City of London, EuSpRIG 2005
- Weerasekara and Gooneratne, Enterprise Resource Planning (ERP) System Implementation in a Manufacturing Firm, Accounting and Management Information Systems 22(1) (2023)
- Brynjolfsson and Kemerer, Network Externalities in Microcomputer Software: An Econometric Analysis of the Spreadsheet Market, Management Science 42(12) (1996)
- Microsoft Support, Keyboard shortcuts in Excel and Advanced options
- McGraw Hill, 10 in-demand software skills for accountants, Lightcast job-posting data (April 2025)
- ICAEW, Spreadsheet Competency Framework
- Baker, Powell, Lawson and Foster-Johnson, Comparison of Characteristics and Practices amongst Spreadsheet Users with Different Levels of Experience, EuSpRIG 2006
- Sarkar and Gordon, How Do People Learn to Use Spreadsheets?, PPIG 2018
- Peyton Jones, Blackwell and Burnett, A User-Centred Approach to Functions in Excel, ICFP 2003
- Scaffidi, Shaw and Myers, Estimating the Numbers of End Users and End User Programmers, IEEE VL/HCC 2005
- Hermans, Jansen, Roy, Aivaloglou, Swidan and Hoepelman, Spreadsheets are Code: An Overview of Software Engineering Approaches Applied to Spreadsheets, SANER 2016
- Gordon and Peyton Jones, LAMBDA: The ultimate Excel worksheet function, Microsoft Research blog (January 2021)
- Microsoft Excel Blog: dynamic arrays preview (2018), LET generally available (2020), LAMBDA generally available (2022), Python in Excel (2024), Excel turns 40 (2025), Excel in 2025 (2025)
Built by people who learned to model in Excel
Novi keeps what the research says the grid gets right: numbers you can see, changes that show at once, and the model in finance’s hands.