The finance data stack, mapped
Every finance function does two jobs. Most of the software was bought for one of them.

Ask a CFO to sketch the company’s finance systems and you get more or less the same drawing every time. The ledger in the middle. Billing, purchasing and payroll around it, with arrows pointing in. A box for consolidation, a box for reporting, the bank off to one side. And somewhere in a corner, usually drawn last and a bit smaller than the rest, a box labelled “planning”, or just “Excel”.
The drawing is correct, and it doesn’t help much, because it’s a drawing of software. Nobody in finance thinks about their work as software. They think in functions: accounting, treasury, tax, controlling, FP&A. So we’ll draw the map the other way round, starting with the functions and what each of them actually does, and only then asking which systems hold what.
We’ll assume a mid-sized group with a handful of legal entities in three or four countries and a finance team of a few dozen people. A smaller company has the same map. One person just holds more of it.
One function, two jobs
Almost every function in finance does two jobs, and the two have surprisingly little in common.
The first job is compliance. You record what happened and report it to people outside the company, by rules the company didn’t write. That means the statutory accounts, tax returns, payroll filings, the covenant certificate for the bank, returns to a regulator if you have one, and now, for a growing number of companies, a sustainability statement. There is one right answer, it’s about the past, and someone independent checks it. The deadlines aren’t yours either. The tax office has no interest in how busy your quarter was.
The second job is performance. Here you answer questions about how the business is doing and where it’s heading, and the rules are your own: your drivers, your segments, your idea of what counts as a product line. There’s never just one answer. There’s the budget, the latest forecast, and the downside case somebody asked for on Tuesday afternoon. Nobody audits any of it. It gets judged by whether it helped someone make a decision.
In an earlier post we said that accounting records what happened and FP&A argues about what should happen next. That’s true, but it undersells how far the split goes. It doesn’t run between two departments. It runs through the middle of nearly every function. The treasurer certifies covenants and also forecasts cash. The tax team files returns and also has a view on next year’s rate. Payroll makes sure everyone is paid correctly, and somewhere else in the building someone is planning how many people there will be to pay.
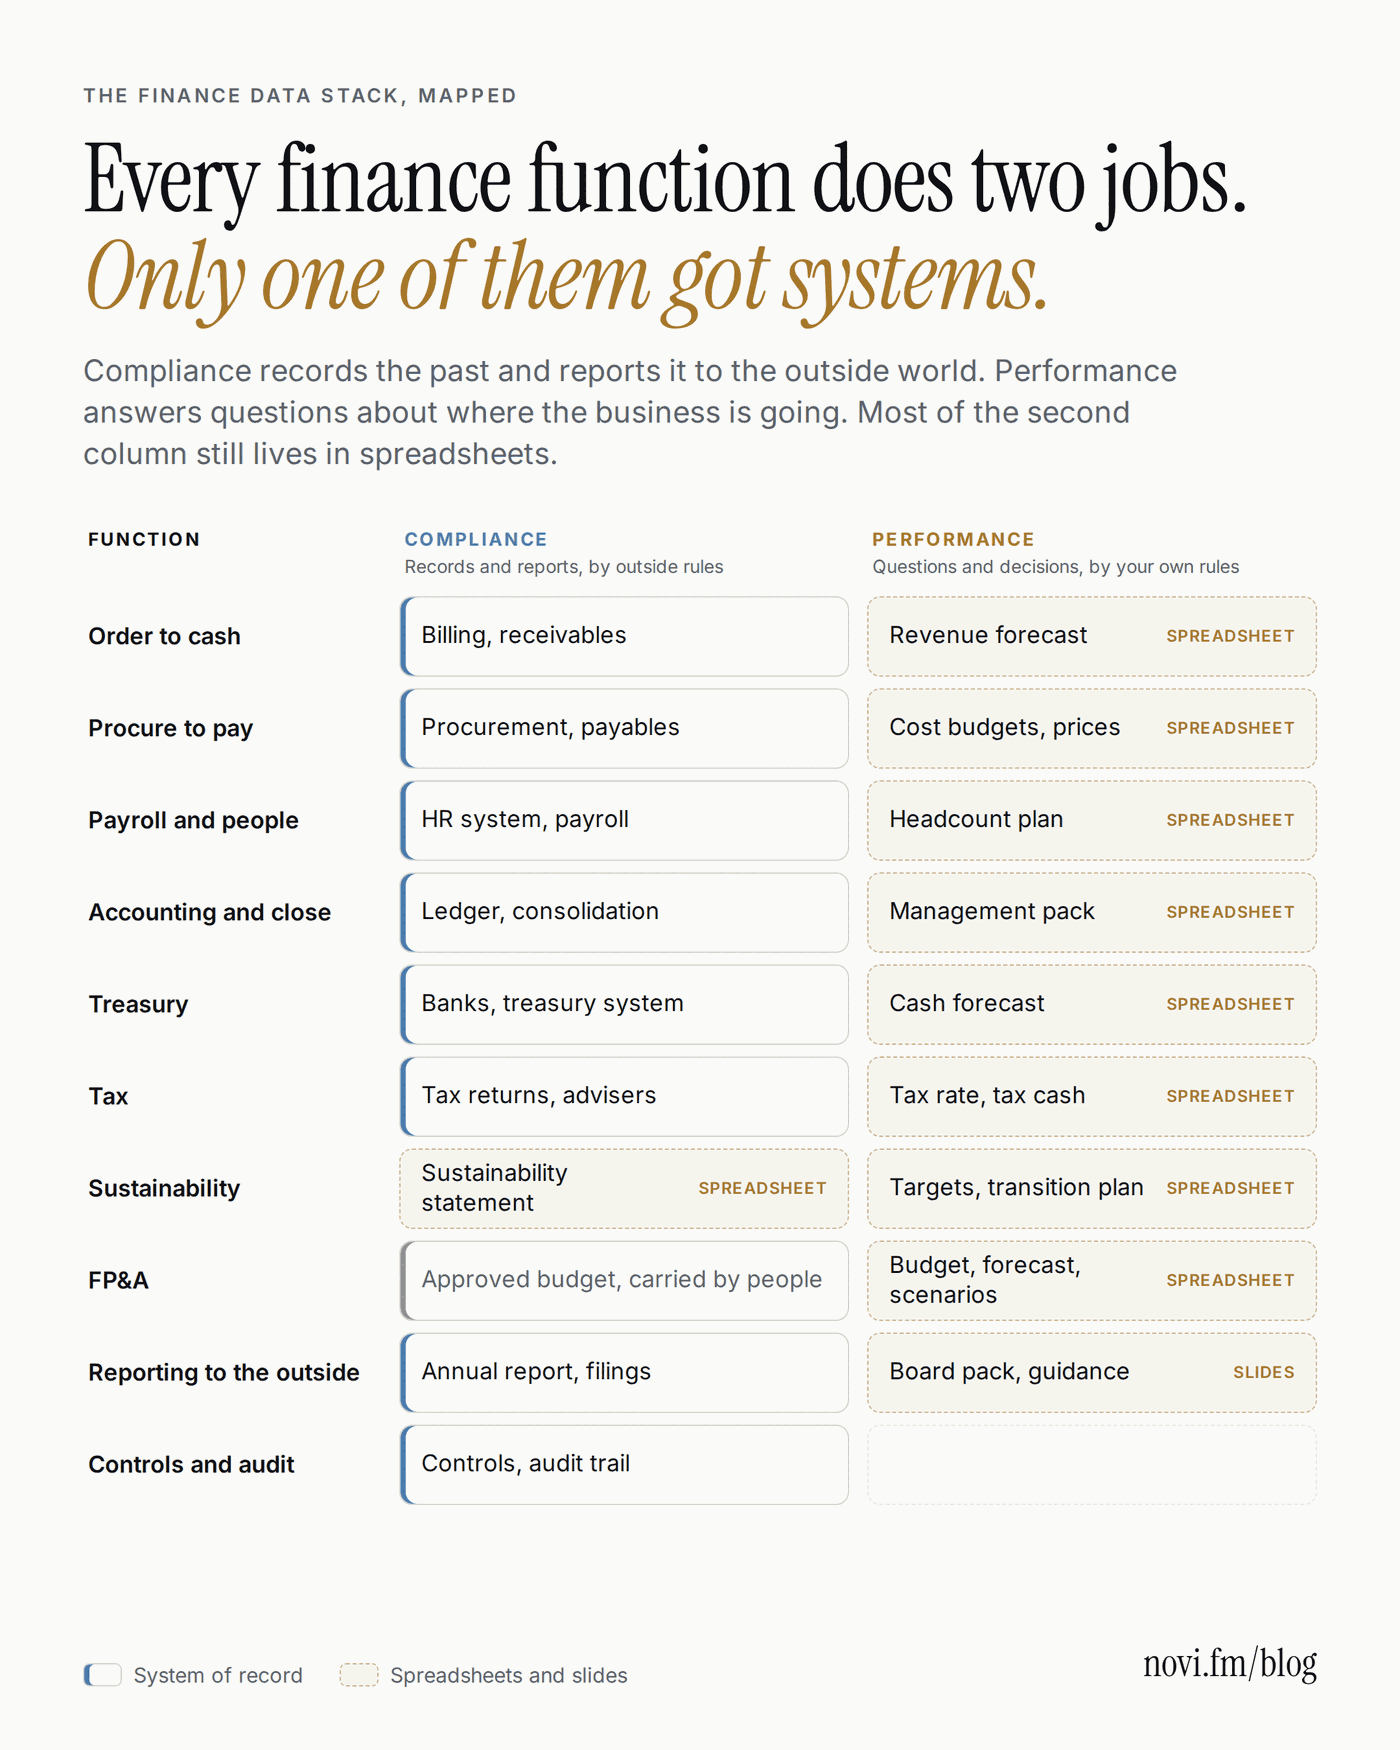
So the map is really a grid, with the functions down the side and the two jobs across the top.
Going down the rows
Three functions are where the transactions are born, so they’re a good place to start.
Order to cash covers invoicing, revenue recognition, receivables and collections. All of that is compliance, and it’s recorded in the billing system and the receivables ledger. Upstream of it sits the sales pipeline, which finance doesn’t own but depends on more than it would like to admit. The performance side is the revenue forecast, pricing and customer profitability. Sales keeps a forecast of its own in the pipeline tool. Finance usually exports it, takes a bit off for optimism, and rebuilds it in a spreadsheet.
Procure to pay is approvals, purchase orders, matching invoices to deliveries, paying suppliers and checking expense claims. The records are excellent, and the auditors have made sure of that. The forward-looking part is cost budgets, price assumptions for the next contract round, and what a jump in a commodity price would do to the margin. It’s often kept in a spreadsheet by the category manager that nobody in finance has ever opened.
Payroll is compliance in its purest form. Pay the right people the right amount, withhold the right tax, file on time, every month, under employment law that changes every January. The HR system knows who works here. What it doesn’t hold is the headcount plan, meaning the open roles, start dates, the pay review and the leavers you can’t name yet. Almost everywhere that lives in a spreadsheet of its own, and it never quite agrees with HR’s number.
Accounting and close sits in the middle of all this. Whatever the three functions above record ends up in the general ledger. It gets closed at month end and turns into the statutory accounts of each entity and then, after eliminations and currency translation, the consolidated accounts of the group. This is the best-equipped corner of finance, and rightly so. But accounting has a performance job as well, and it’s a big one: the management accounts. They use the same transactions, cut the way the executive team thinks about the business (by segment, by product line, by regions that ignore legal entities), with allocations and adjustments that will never appear in a statutory report. In most companies that pack is rebuilt every month from a ledger extract, in a spreadsheet, by people who have just finished the close and would quite like to go home.
Treasury makes payments, reconciles the bank, pools cash, documents hedges and certifies covenants. It knows today’s cash to the cent. Next month’s cash is another matter. The thirteen-week forecast and the longer funding view are treasury’s performance side, and they draw on almost every other row of the map.
Tax is small in headcount and large in money. Its compliance side is heavy: corporate returns, VAT, transfer-pricing documentation, and country-by-country reporting for the bigger groups, much of it shared with outside advisers. The performance side is lighter. It covers the effective tax rate in the plan, when tax actually gets paid, and what a restructuring would cost. It tends to be worked out apart from the plan it belongs to and pasted in near the end.
Sustainability is the newest row, and an odd one. In Europe the sustainability statement now sits in the management report next to the financial statements and gets external assurance, so it has landed on the CFO’s desk whether finance asked for it or not. That makes it compliance: outside rules, a deadline, a signature. But a lot of the data doesn’t come from the ledger at all. It’s kilowatt-hours from utility bills, litres of diesel from fuel cards, emission estimates from suppliers. There’s no mature system of record behind most of it yet, so it gets gathered in spreadsheets and then has to be defended as carefully as the accounts. The performance side (targets, the transition plan, the carbon cost of an investment) is younger still.
FP&A is the exception. It lives almost entirely on the performance side, with the budget, the forecast, the long-range plan, scenarios and variance commentary, and it takes something from every other row. It does have one compliance-like moment, and it’s easy to miss. Once the budget is approved, it stops being a forecast and becomes an authority. It sets the spending limits and the sales quotas, and the number of people HR is allowed to hire.
Reporting to the outside is where the compliance column comes out: the annual report, the filings, the lenders’ pack, and published results if you’re listed. Its performance twin is the board pack, plus guidance for listed companies. That’s the numbers with a story attached, and the story is usually argued over far longer than the numbers.
Controls and audit sit wholly on the compliance side, so we’ll only say one thing about them. They’re the reason a compliance number is trusted and a performance number often isn’t. A figure that went through the close has an audit trail. A figure in a spreadsheet that has been emailed around three times has a filename ending in “v7_final”.
The whole map
| Function | Compliance, and where it lives | Performance, and where it lives |
|---|---|---|
| Order to cash | Billing, receivables, revenue recognition | Revenue forecast in a spreadsheet, from a pipeline export |
| Procure to pay | Procurement, payables, expenses | Cost budgets and price assumptions in spreadsheets |
| Payroll and people | HR system, payroll, payroll filings | Headcount plan in a spreadsheet |
| Accounting and close | Ledger, consolidation, statutory accounts | Management pack, rebuilt monthly in a spreadsheet |
| Treasury | Banks, treasury system, covenant certificates | Cash forecast in a spreadsheet |
| Tax | Returns, transfer pricing, advisers | Tax rate and tax cash in a spreadsheet |
| Sustainability | Sustainability statement, mostly in spreadsheets | Targets and transition plan in spreadsheets |
| FP&A | The approved budget as an authority | Budget, forecast, scenarios in spreadsheets, sometimes a planning tool |
| Reporting to the outside | Annual report, filings, lender reporting | Board pack and guidance, in slides |
| Controls and audit | Controls, audit trail |
Read it down the columns instead of across the rows and a few things stand out.
The left column is full of systems of record, and that isn’t an accident. For decades, law and auditors have required every company to record and report in broadly the same way. When everyone has the same obligation, software can be built once for all of them. The right column never had that push. Every company’s drivers are its own, and nobody gets fined for a bad forecast. So, function by function, it filled up with spreadsheets. That’s also why sustainability is interesting to watch. It’s a compliance duty that hasn’t had time to follow the usual pattern, and for now it still looks like the right-hand column.
The two columns meet at the ledger. Transactions go in from the operational functions and statutory reports come out, and once the month is closed the same actuals cross over and become the starting point for every forecast. Both columns also stand on the same master data (the chart of accounts, the entities, the cost centres, the product list), which was usually designed for booking and then pressed into service for analysis. The statutory view and the management view will never be identical, and reconciling them is a job with no end date.
And nearly all the arrows point one way, towards the ledger and then out of it. Payroll has no idea the sales pipeline exists. The only thing that flows back is the approved plan, and it doesn’t travel through any system. People carry it. A budget holder checks a limit, and a recruiter checks the approved headcount.
What actually talks to what
Less than the vendor diagrams suggest. The transactional systems post into the ledger, and usually do it well. Most of the rest moves by export: a report saved to a file, the file opened in a spreadsheet, the spreadsheet copied into another spreadsheet. Larger groups add a data warehouse and a reporting tool, which makes the exports tidier without changing where they go.
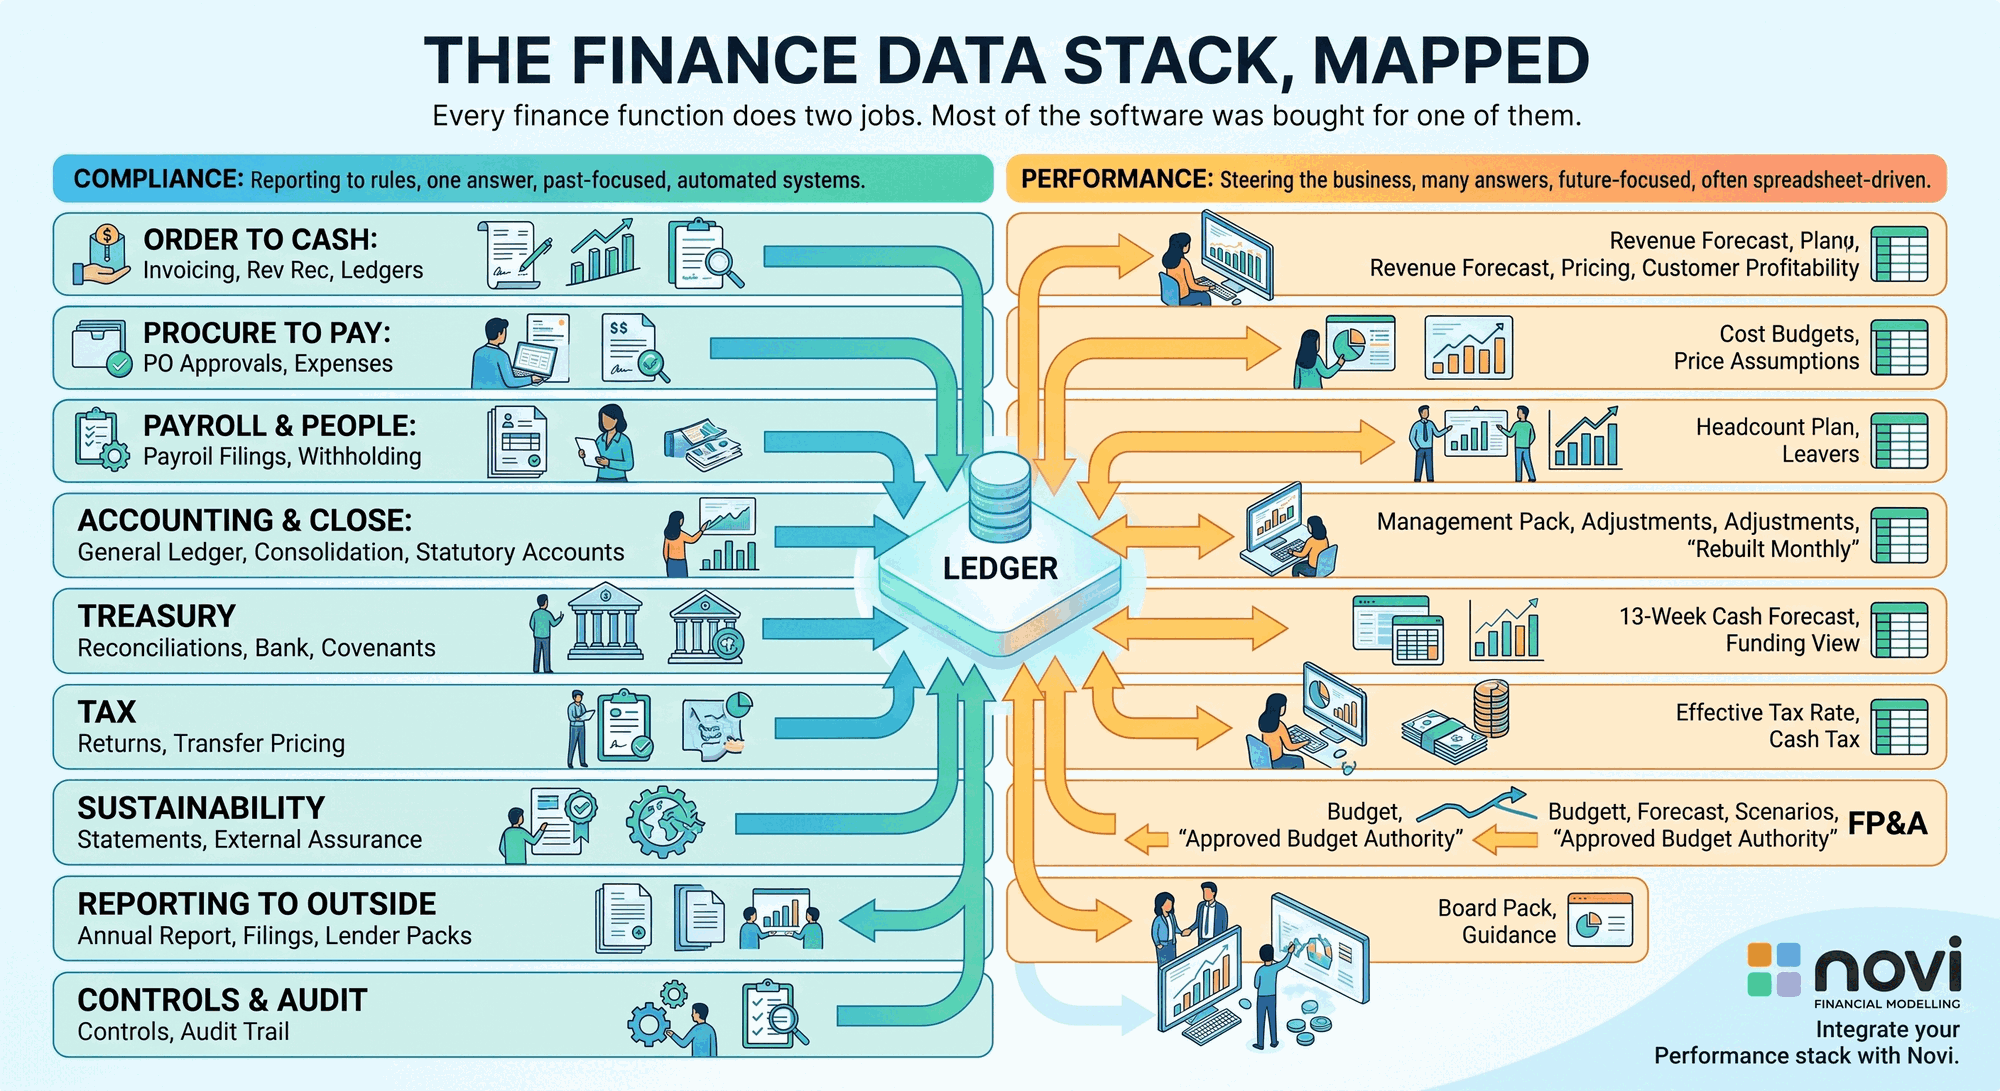
What really integrates most finance departments is the spreadsheet and the handful of people who look after it. It works better than it has any right to, right up until one of them leaves.
Each of those joints gets its own post later in this series, starting with getting data out of the ledger. After that come the chart of accounts, master data, the mapping tables that translate one system’s codes into another’s, and how much integration is actually worth paying for.
Where the models are
Every cell in the right-hand column is a model: of revenue, cost, headcount, cash, tax and, increasingly, emissions. Each one answers a question about the future using rules the company set for itself.
Mostly they live in one of three places. Some sit inside operational systems, like the forecast in the pipeline tool or the production plan at the factory. Most sit in spreadsheets, one or several per function. And some companies have a planning tool that holds the budget and not much else.
The trouble is that real questions don’t stay in one row. Take a fairly ordinary one from the board. The price increase planned for October might slip to November. What does that do to year-end cash, and are we still inside the covenant?
The price list is in billing. Volumes are partly in the pipeline and partly in last year’s invoices. The cost side depends on a supplier contract procurement renegotiated in the spring. Payment terms decide when any of it turns into cash. The covenant definition is in the loan agreement, and last quarter’s certificate is a PDF on the treasury drive. The question touches four models, owned by four people and built on four sets of assumptions. They’ll agree with each other and with the closed actuals only once somebody makes them agree, which in practice means an analyst, an evening and one more spreadsheet.
In Where the Engine Sits we described a company in three layers: transactions at the bottom, the processes that run the business above them, and an analytical layer on top that works out what it all means. The left-hand column of this map lives in the bottom two layers. The right-hand column is meant to be the third, except that in most companies nobody ever built it as a layer. It’s a scattering of files.
A business is one thing, and it ought to have one model.
Revenue, cost, people, cash and tax belong together in that model. Finance should own it, the systems that already record the past should feed it with actuals, and it should be quick to change when the question does.
Why the right-hand column matters
Compliance keeps the company out of trouble. It’s essential work and it’s well served, but nobody has ever been invited into a strategy discussion for filing the VAT return on time.
The performance column is the reason the CFO is in that discussion at all. It’s where finance stops describing the business and starts helping to steer it. It’s also the column software has served least, because no two companies fill it in the same way.
That’s the column we built Novi for: the performance side of every function, modelled in one place that finance owns, fed by the systems of record and replacing none of them.
The next post in the series starts where the data leaves the ledger.
One model for the right-hand column
Novi models the performance side of every function in one place that finance owns, fed by the systems of record and replacing none of them.